We’re excited to announce the launch of Vector Charts: a Nautical Chart API for the modern web.
Vector Charts is the easiest way to add beautiful, informative vector nautical charts to your maritime-related product. We provide a Vector Tile API which can be dropped into any web application to add nautical charts.
The Problem
If you’re building a maritime product nautical charts are an important situational awareness & safety tool - but it was previously too hard to add them to modern web apps.
Existing options are largely focused on the ECDIS or desktop application market, and render chart data as raster (pixel-based) imagery. This is a bad fit for web applications which can be highly dynamic, may integrate 3D features, and which stream data in live.
Our Solution
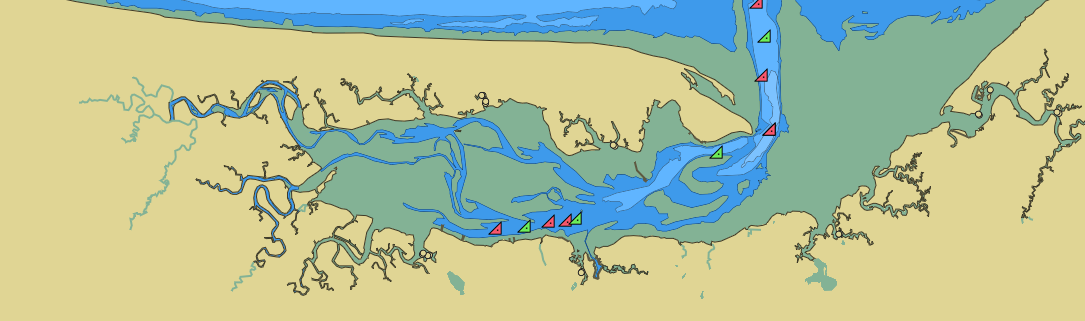
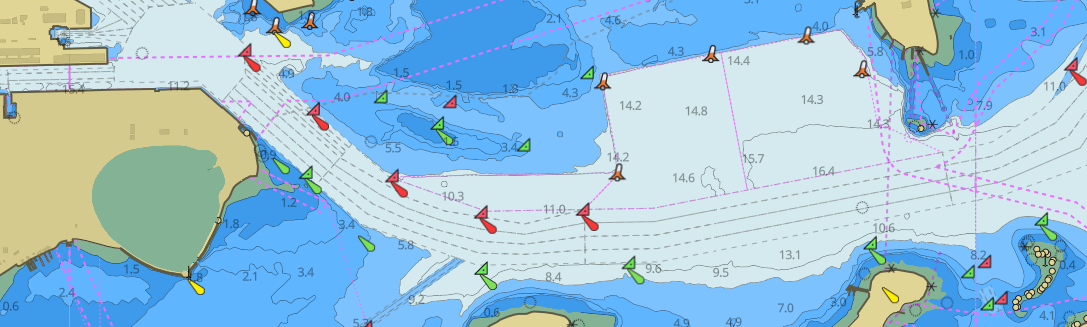
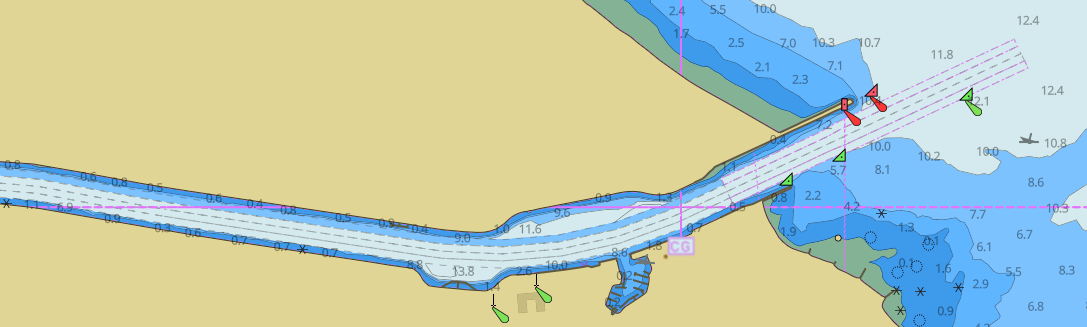
We combine maritime data with the modern standard web-based maps: Vector Tiles. Vector Tiles transmit map data as bandwidth-efficient vector data instead of pixel imagery, which makes them a great fit for nautical chart data. The result is crisp, beautiful vector imagery that fits perfectly into your application.
Along with our core Vector Tiles technology, we manage chart sourcing, licensing & updates to our core database, allowing your team to focus on building a great product.
For advanced use cases such as maritime robotics, we offer APIs to query raw data directly for use in path planning & computer vision.
Get Started Now
It’s incredibly easy to get started with Vector Charts. Sign up in 5 minutes or less, and drop the API into any of the popular web map libraries.