


We’re excited to announce the launch of the Vector Charts Crowdsourced Data Program. Official charts can be out of date in changing harbors and shallow areas such as rivers and creeks. User reports can help improve ocean maps and make navigation safer by filling the gaps in chart coverage and providing more updated information to inform where charts should be updated.
Our Crowdsourced Data Program makes it easier for maritime product developers and end users to contribute with a fully-managed API for user data submission and display.
How It Works
Use our Crowdsourced Data API to submit hazard and depth reports. We process the data, share it with the hydrographic community, and display data back to your users via our API. Crowdsourced data can be easily shown on any Vector Charts map using our styles, which call attention to user safety reports. All data submission and display is opt-in.
Types of Data
The Crowdsourced Data Program supports two types of user reports: Hazards and Bathymetry.
Report Hazards
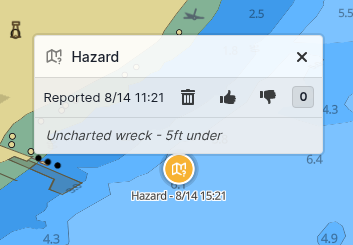
The Hazard Report API allows users to report emphemeral hazards such as debris, wrecks or marine wildlife. These show as a point on the Vector Charts map with description, and can be upvoted or downvoted to confirm if the hazard is still present.
Report Bathymetry
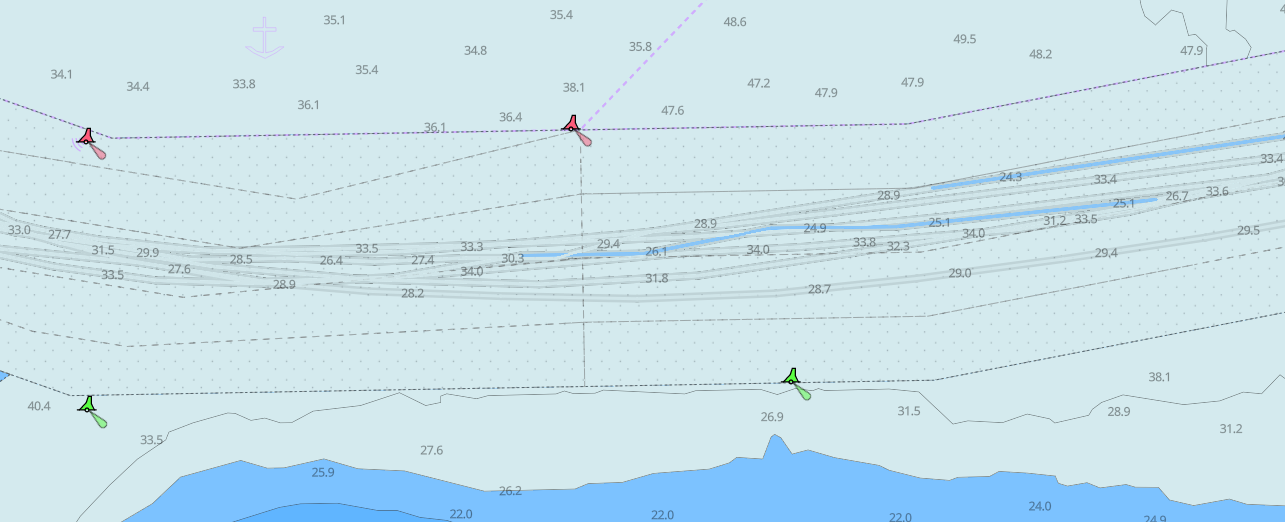
The Bathymetry Report API allows users can report position and depth information from their sonar or other depth-sensing devices. This data forms a “track”, or path, with depth information that can help fill gaps or inform better chart coverage. This data is shown as a depth-shaded line on the Vector Charts map.
Easy & Free
We designed our API to be easy to use: just start contributing data with one API call. We operate the end-to-end ecosystem to receive, store, process & share user reports at scale.
The Vector Charts Crowdsourced Data Program is free to use for any users on the Vector Charts platform. To get started, create an account or reach out to our team.


